


Marshall Science Research and Projects Division
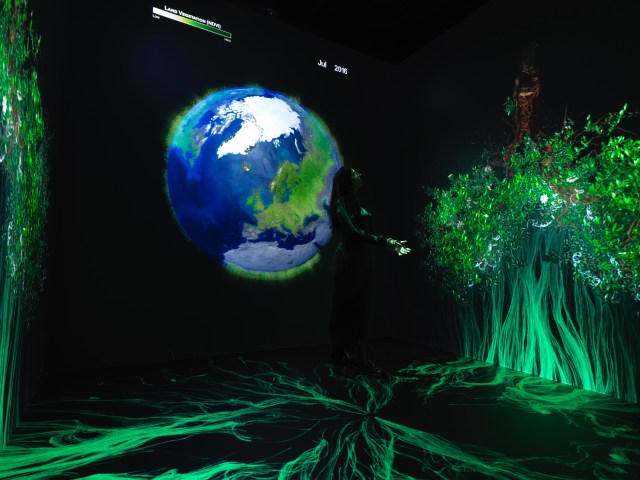
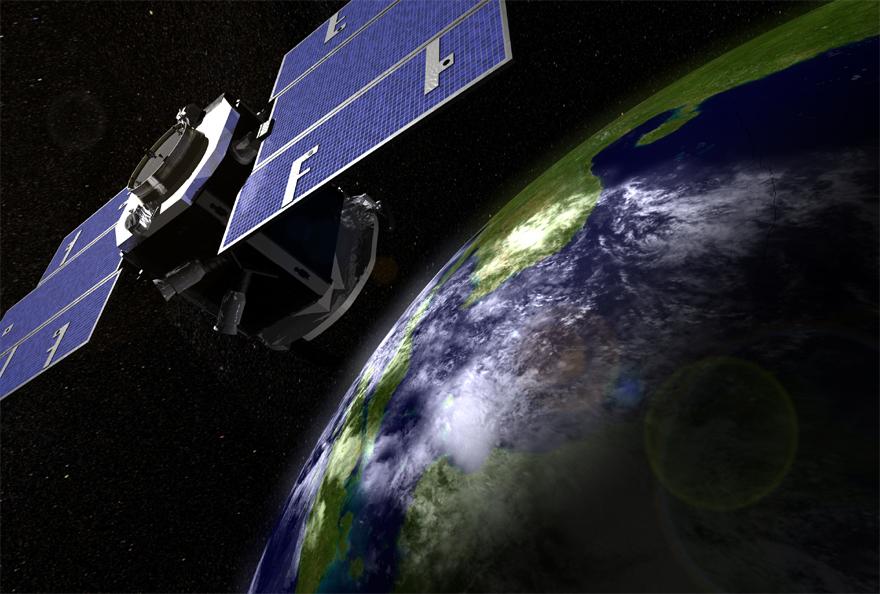
The mission of the Science Research and Projects Division at Marshall Space Flight Center is to expand scientific knowledge and explore the Earth and our universe in support of National and Agency goals. We are comprised of NASA civil servants and colleagues working in alliance with academia, US federal agencies, and international partners to develop space, airborne, and ground-based capabilities to better understand our home planet and its space environment.
SRPD Organization
Latest Articles

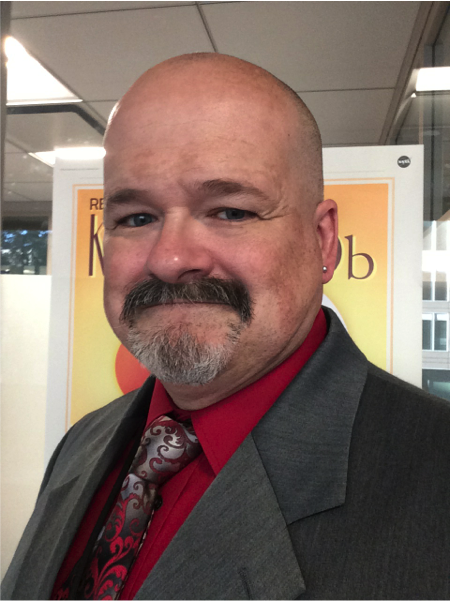
Three papers authored by Philip Stahl (ST10) were published in a special session of the Journal of Astronomical Telescopes and Instrument Systems (JATIS) on large mission lessons learned. The papers were titled; “Large mission implementation lessons from history”, “Webb Space Telescope primary…
H. Philip Stahl (ST10) was selected to lead the HWO Telescope Mirror Assembly & Structure Technology (Tele MAST) Sub-Group. As a member of the HWO Technology Assessment Group (TAG), Stahl attended the American Astronomy Society (AAS) Meeting 243 in New…
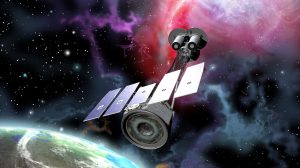
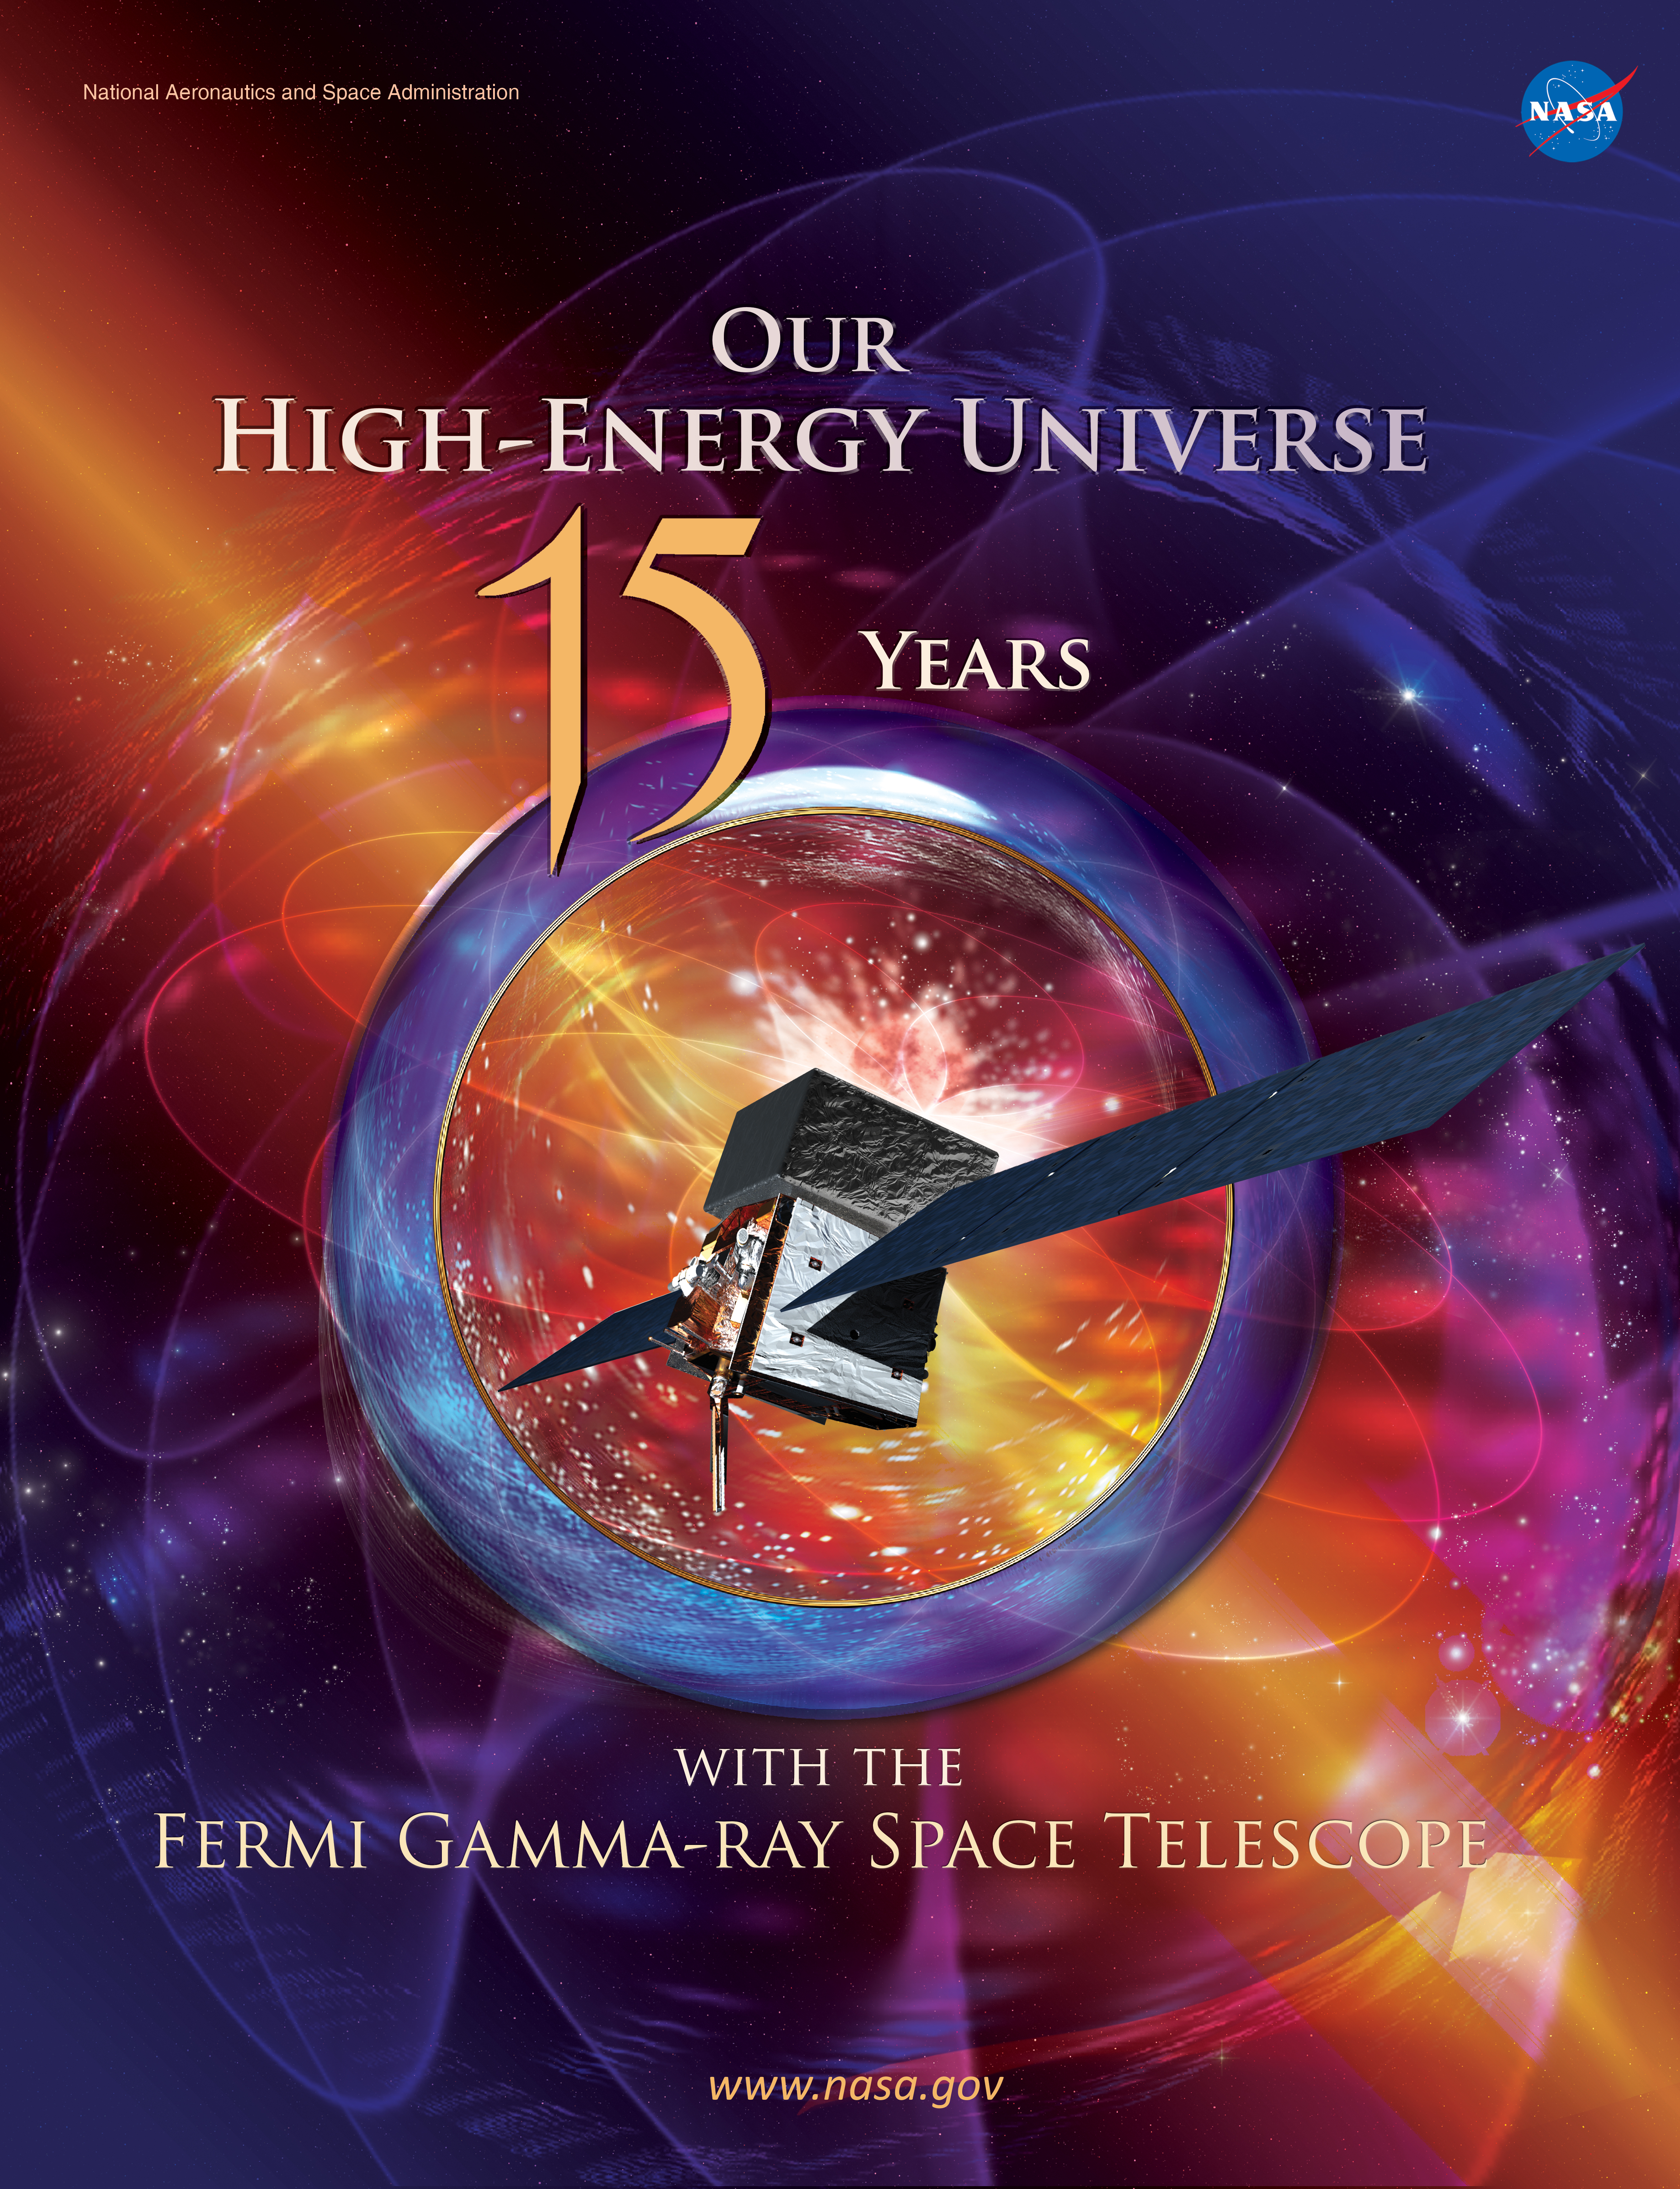
The High Energy Astrophysics Division (HEAD) of the American Astronomical Society (AAS) has awarded the 2024 Bruno Rossi Prize to retired NASA astrophysicist Martin Weisskopf (ST12 Emeritus), Italian Space Agency principal investigator Paolo Soffitta, and their team for development of…
The Science and Research Projects Division (SRPD) web based Large Budget Proposal Tool went live Friday, 7/21/23. The automated budget tool was created to increase efficiencies and reduce errors in preparing multiple budget scenarios of large flight proposal opportunities, and…
The Transform to Open Science (TOPS) mission is a NASA Science Mission Directorate (SMD) initiative designed to rapidly transform agencies, organizations, and communities to an inclusive culture of open science, and is a part of NASA’s (Open-Source Science Initiative) OSSI.…
Pease contact Elizabeth Blackwell at wendy.e.blackwell@nasa.gov for any website inquiry.